blog post List
17 Stock Chart Patterns All Traders Should Know
- How the Ascending Triangle Pattern Works
- Symmetrical Triangles Work
- How the Descending Triangle Works
- How the Bump and Run Reversal Works
- Cup and Handle Pattern Works
- Double Bottom Pattern Work
- Double Top Pattern Work
- How the Rising Wedge Pattern
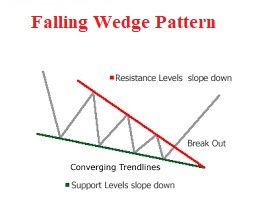
- How the Falling Wedge Pattern
- How the Flag Pattern Work
- How the Pennant Pattern Work
- How the Head and Shoulder Top
- How Inverse Head and Shoulders
- How the Rounding Bottom Pattern
- How the Price Channel Pattern
- How the Triple Top Reversal Pattern
- How the Triple Bottom Reversal Works

- Top Benjamin Graham Quotes on Value Investing
- How to buy the dip in stocks
- What are dividend Stocks
- What are bonus shares
- 20 Profitable Stocks With Low PEG Ratios
- What drives the stock price
- PE Ratio Formula
- Diff bonus issue and stock dividend
- How to read a cash flow statement
- How To Buy Shares For Beginners
- What is Demat & Trading Account
- Growth stock vs Value stock
- Basic Fundamental Analysis
- How does the stock market work
- Types of Fundamental Analysis
- How to choose strike price
- Best stock to buy for long term growth
- What is bonus shares issue
- What is diversification in investing
- Cyclic Stocks and Non Cyclical Stocks
- Penny Stocks Pros and Cons
- How to Find Good Dividend Stocks