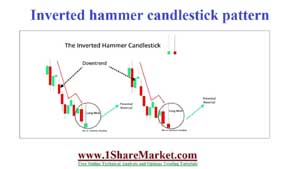
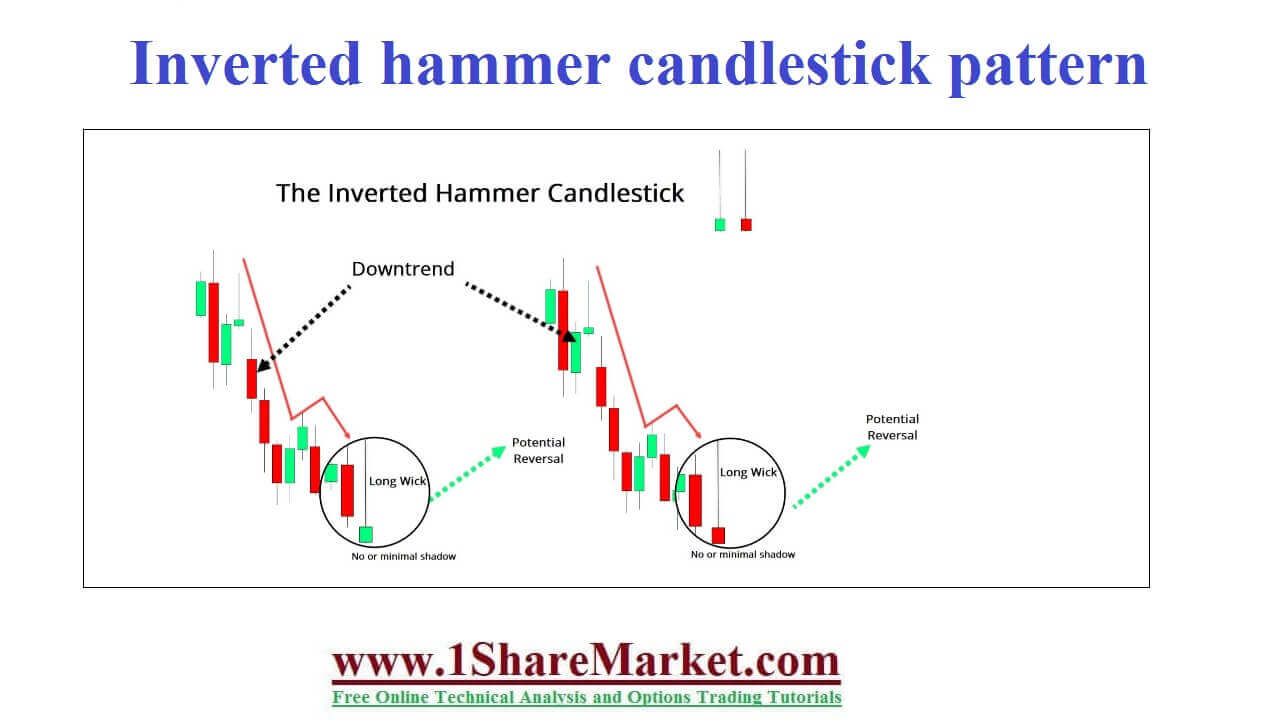
Inverted hammer candlestick pattern is like the Shooting Star formation created when the open, low, and close are at the same price. There is a long upper shadow which is at least twice the length of the real body. The bullish inverted hammer candlestick is formed when low and open is the same and considered as a strong bullish sign. The inverted hammer gets the name from the shape and looks like an upside-down hammer. We should look for the long upper wick, short lower wick, and small body. When bullish traders start to gain confidence the inverted hammer is formed. The top part is formed when bull pushes the price up and the lower part is caused by bears to resist the higher prices. The bullish trend will be more strongly and the market will settle at a high price. These will look like an upside-down version of the hammer candlestick pattern and appears in an uptrend as a shooting star. Also called a chart pattern occurred at the end of a downtrend when pressure from buyers raises the price of an asset. The difference between an Inverted hammer and a shooting star is the nature of the trend in which they appear. If a pattern occurs in an upward trend indicating bearish reversal then is a shooting star. Appearing in a downward trend indicating bullish reversal called an inverted hammer. The pattern is formed of two candles as the first candle appears as a long line with a black body. Both red or green color and its upper shadow is two times the size of the real body
We can start trading after the inverted hammer is identified to reap the benefits of security due to the bullish reversal. It is easy to identify the criteria associated with its recognition as proportionality between shadow and real body length.
Limitations:-The period of the identification may lead to an upward reversal because there is no guarantee that this will last for an extended period. If buyers are unable to sustain in the market the security price may head towards another downward trend. These patterns are one of a number of candlestick patterns among a wide variety of metrics that are used to forecast market behavior.
view moreThese is also called a reversal candlestick pattern that appears at the bottom of a downtrend and signals a potential bullish reversal. The candlestick pattern will get its name from an inverted hammer in real life. It is a signal that can help you identify new trends. These will tell a trader that buyers are putting pressure on the market. He will warn that about the price reversal following a bearish trend. It’s important to remember that the these is not viewed in isolation. Trading the inverted hammer candle will involve a lot more instead of simply identifying the candle.
© 2020 All rights reserved My blogs (Posts) and videos is only educational purpose on stock market and depend on my self research and analysis. I can't advice to buy/sell any stock. because I'm not SEBI registered.If someone wants to inter the stock market, then my advice is first learn from an authorize institution or take advice from your authorized adviser.
Design by
Sraj Solutions Pvt. Ltd. Additional Services : Refurbished Laptops Sales and Servise, Python Classes And SEO Freelancer in Pune, India