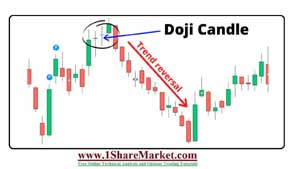
Learn Doji Formation with Limitations of a Doji. The bearish traders will reject the higher price from the market. They should be bearish traders who try to push prices as low as possible and fight back to get the price back up. A Doji is a candlestick used for security purposes with an open and close with virtually equal components. Doji candlesticks look like a cross inverted cross/ plus sign. The Doji is neutral patterns featured in important patterns. The Doji means mistake that refers to the rarity of the open and close price exactly the same. The pattern is formed when a market price is the same at open and close. Here the vertical line of these pattern is called a wick and the horizontal line is the body. The wick varies in length the top represents the highest price and the bottom at the low. The body will represent the difference between the opening and closing prices. The element varies in height but not in width. These is neutral patterns that are also featured in a number of important patterns.
The bearish traders will reject the higher price from the market. They should be bearish traders who try to push prices as low as possible and fight back to get the price back up. The market has exploded upward and downward options but ‘rests’ without committing to either direction. The upward and downward movements that occur between open and close form a wick. The body is formed when the price closes at more /less the same level as an opening. Doji is formed in three major types as gravestone, long-legged, and dragonfly. Every candlestick pattern has four sets of data which helps to define its shape. The body creates a filled or hollow bar by candlestick pattern. The lines which extend out of the body are called shadows. Stocks that are closer than its opening have a hollow candlestick. Doji look like a plus or cross sign and have small nonexistent bodies. The Doji represents indecision on the side of both buyers and sellers. Some of the analysts will interpret the sign as a reversal. At times the buyers or sellers gain the momentum for a continuation trend.
view more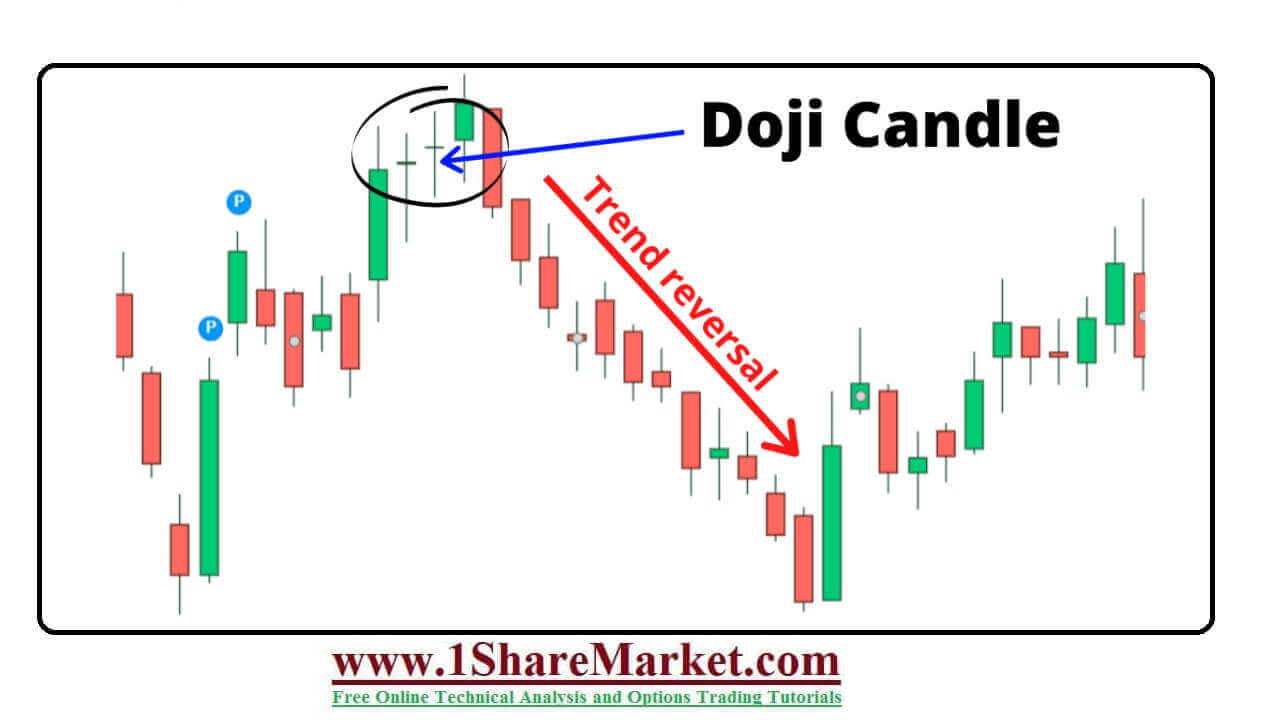
The Doji candlestick is a neutral indicator that provides little information. The common occurrence is not present so not a reliable tool for spotting things as price reversals. Assurance is there as the price continues in the expected direction following the confirmation candle.
© 2020 All rights reserved My blogs (Posts) and videos is only educational purpose on stock market and depend on my self research and analysis. I can't advice to buy/sell any stock. because I'm not SEBI registered.If someone wants to inter the stock market, then my advice is first learn from an authorize institution or take advice from your authorized adviser.
Design by
Sraj Solutions Pvt. Ltd. Additional Services : Refurbished Laptops Sales and Servise, Python Classes And SEO Freelancer in Pune, India