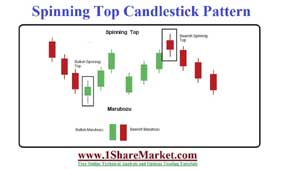
Spinning Top Candle : The spinning top candlestick pattern is formed when buyers and sellers balance each other resulting in opening and closing price levels. There are two variations of the chart pattern as bullish and the bearish. The bullish is formed when the closing price is higher than the opening price and bearish occurs when the opening price is higher than the closing price. It is a short real body vertically centered between long upper and lower shadows. The candlestick pattern will represent indecision about future direction assets. The buyers will push the price up during the period and sellers push the price down during the period. After a strong price advance/decline, the spinning top can signal a potential price reversal.
A Pattern can have a close above or below the open but two prices need to be close. The real body should be small and show the difference between the open/close prices. The buyers and sellers push the price that cannot maintain it. They are signs of indecision in the asset because the long upper and lower shadows don’t result in a meaningful change in price between open and close. The bulls will send the price higher and bears send the price lower. These may signal a trend change and occur at the top of an uptrend. It could be a sign that bulls lose control and the trend may reverse. These is at the bottom of a down tread signal that bears a losing control. The confirmation will help to clarify what exactly the spinning top says. These candlestick patterns which means they work well in conjunction with other forms of technical analysis.
A pattern will tell the traders that they ate the market because there was much change between the opening and closing price. Traders do not act on any candlestick pattern without considering other forms of analysis. We consider other patterns and indicators then confirm the signal to make sure not to stray from your trading plan.
Steps to start trading:First, create an IG trading account or log by existing account. Type the name of the asset which you want to trade in the search bar. Then enter your position size and select ‘buy’ or ‘sell’ in the deal ticket. After this, we can confirm the trade and practice trading using the spinning top chart pattern with the IG demo account.
view more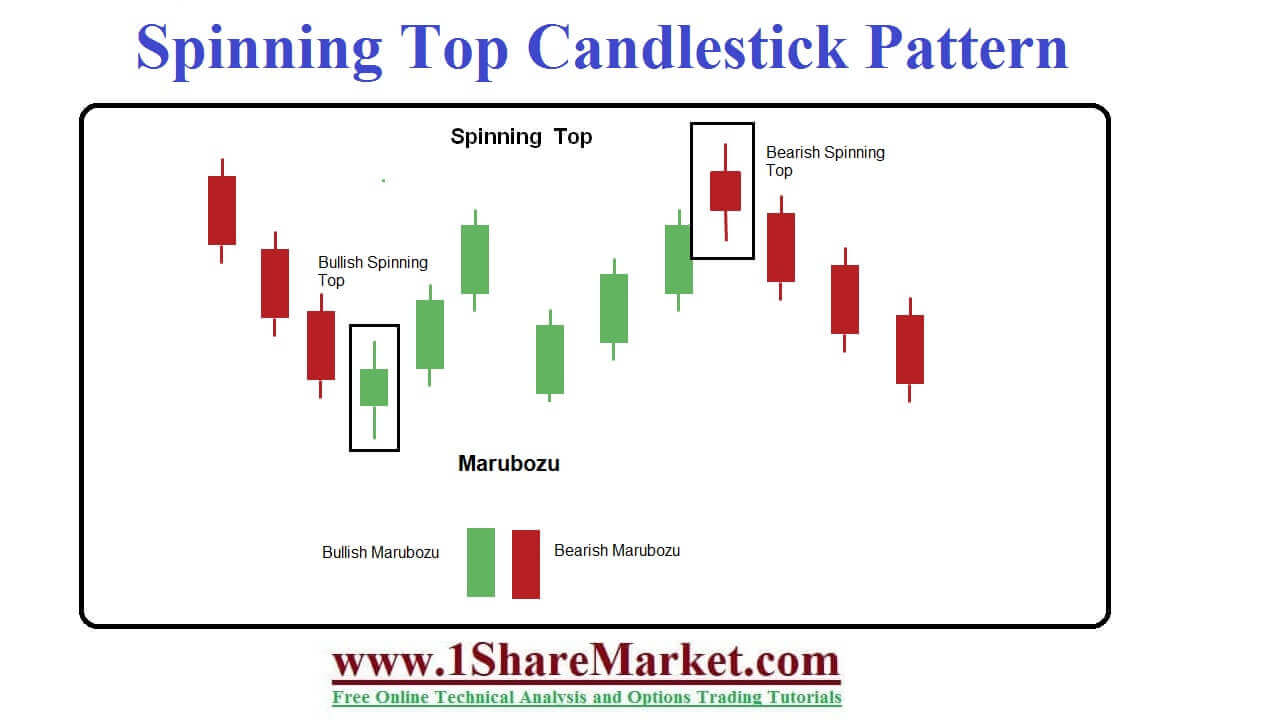
They are formed when the bulls send a higher price than the opening price and the bears push it back down before the market closes. When bearish traders push lower prices than the open prices then bullish traders push it back up before the market closes. The market has exploded upward and downward but settles at more or less an opening price those results in no meaningful change.
The first step to trade is to confirm the signal. Most traders use technical indicators to confirm what they believe. A spinning top is signaling because the indicators will provide more insight into price trends. To trade, you can use derivatives such as spread bets.
They are common which means many of the patterns witnessed will be inconsequential. The spinning top occurs when the price is already moving sideways or is about to start.
© 2020 All rights reserved My blogs (Posts) and videos is only educational purpose on stock market and depend on my self research and analysis. I can't advice to buy/sell any stock. because I'm not SEBI registered.If someone wants to inter the stock market, then my advice is first learn from an authorize institution or take advice from your authorized adviser.
Design by
Sraj Solutions Pvt. Ltd. Additional Services : Refurbished Laptops Sales and Servise, Python Classes And SEO Freelancer in Pune, India