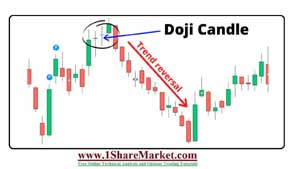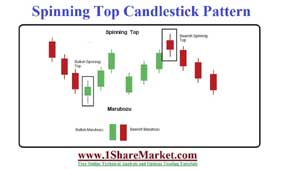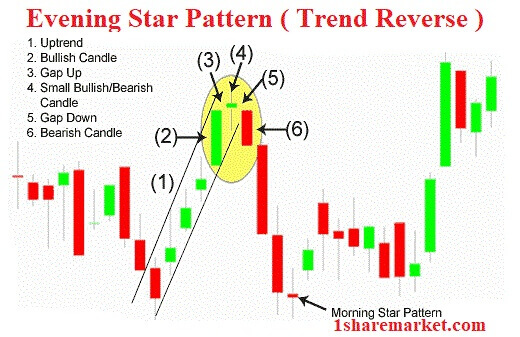
Evening Star Pattern is also called a stock price chart. It is used by analysts to detect when a trend is in a reverse manner. Evening Star pattern are associated with the top price uptrend and signifying that the uptrend is near its end. The pattern will form a three day period as first you will see a large white candle of sustained price rise. This will be followed by a small candle that shows a small price rise. On the third day, there will be a large candle that opens at a price below the second day and ends in the middle of the first day. These is called the bearish counterpart of the morning star pattern. It is the opposite of the morning star with three candlesticks with the middle candlestick being a star. The gap between the real bodies of two candlesticks makes a Doji star. The star indication will indicate that buy to push the price close to the previous period. The market should exhibit higher highs and higher lows. It is a bearish pattern consisting of three candles as large white candlestick, a small body candle then red candle.
The evening stars are formed by the combination of three candles. They are considered an inside bar and come out as a bearish candle if there is a price gap. The third candle has closed below the first candle opening price. The strong reversal pattern is formed at the end of a continued rally. The pattern is a long-bodied candle with a common occurrence in the bull market. When the market opens higher as compared to the previous day, it is closer than another bull market. The sentiment will change during the middle of the second day when the bulls fail to make further headway. These is a combination of two long candles and one short candle. The second candlestick is a short candlestick. If there is a price gap the second candle come out as a little bearish candle and implies price consolidation and indecision. The first candle is a long bullish candle so the Doji candle means that the trend created by the first long bullish candlestick that loses its momentum. The last candlestick is a long bearish candlestick closing below the first candlestick it indicates the beginning of a new trend.
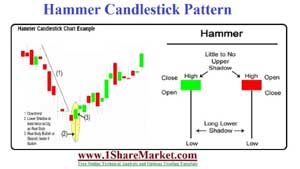
A candlestick pattern presents certain information about a stock. It represents the high, low, and close price for the stock over a given time period. The length of the candle is a function of the range between the highest and lowest price on trading day. Each candlestick tells you four pieces of information in the opening price, closing price, high of the session, and low of the session. The larger candle is greater than the trading range in that given day.
view more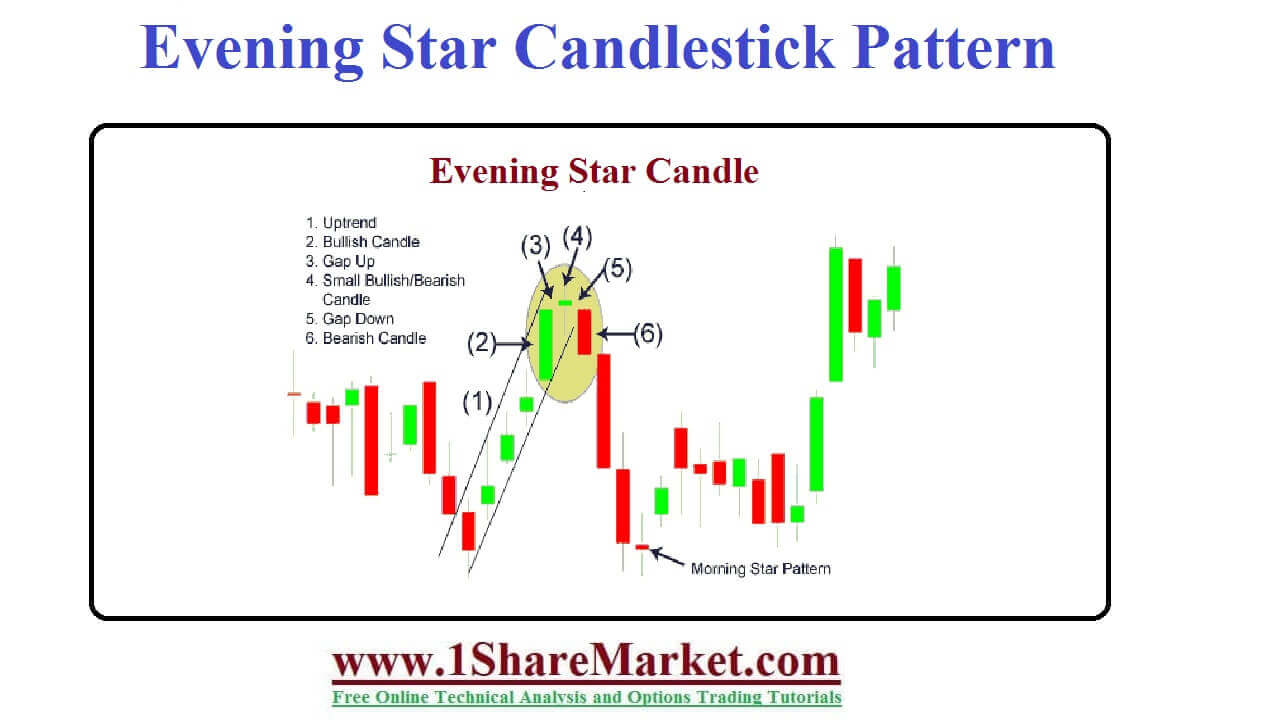
Pattern has a time frame of three candle periods that are measured with its own candle. So daily charts require three days of price action. When the Evening star takes shape the traders heed their charts and sell the stock. The pattern materializes when the price begins to construct at the end of a bull run. The pattern is marked by a green candle that signals a continuation of the current trend.
Trading the Evening Star pattern will take practice and intuition because three candles look like the Evening Star pattern. We should understand the conditions and circumstances where it appears. Traders take a short entry after the third candle closes. To have a better percentage of winning we wait for a breakout and take short entry.
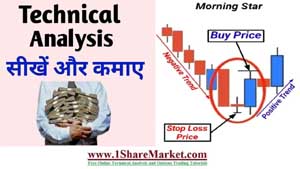
The morning star is a reversal pattern as an inverted evening star. The evening star is a bullish reversal pattern that forms after a downtrend.
It occurs frequently in charts and present entry as exit levels. This pattern is easy to identify as they occur frequently. If signals are a failed reversal then the price is moved further. When the backup is done of volume and indicators like resistance value the signal is confirmed.
© 2020 All rights reserved My blogs (Posts) and videos is only educational purpose on stock market and depend on my self research and analysis. I can't advice to buy/sell any stock. because I'm not SEBI registered.If someone wants to inter the stock market, then my advice is first learn from an authorize institution or take advice from your authorized adviser.
Design by
Sraj Solutions Pvt. Ltd. Additional Services : Refurbished Laptops Sales and Servise, Python Classes And SEO Freelancer in Pune, India