Learn Bullish stick sandwich candlestick pattern and Bearish Stick Sandwich. Here the candlestick sandwich has a middle candlestick with the opposite color of the candlestick on either side. Here the candlestick sandwich has a middle candlestick with the opposite color of the candlestick on either side. Both of which have a larger trading range than the middle candlestick. These patterns occur in both bearish and bullish indications. The candlestick chart is used by traders to determine price movement based on past patterns. The candlestick pattern is the stick sandwich because it has a sandwich if plotted on a price chart. They will have the middle candlestick oppositely colored verses the candlesticks on either side of it. So both of them will have a larger trading range than the middle candlestick. The pattern may indicate either a bullish or bearish trend and used in conjunction with other methods or signals. These pattern occurs in both bull and bear markets. To identify a Stick Sandwich follow the criteria as there must be three candles in a row. Then the middle candle must be opposite of either side of it.
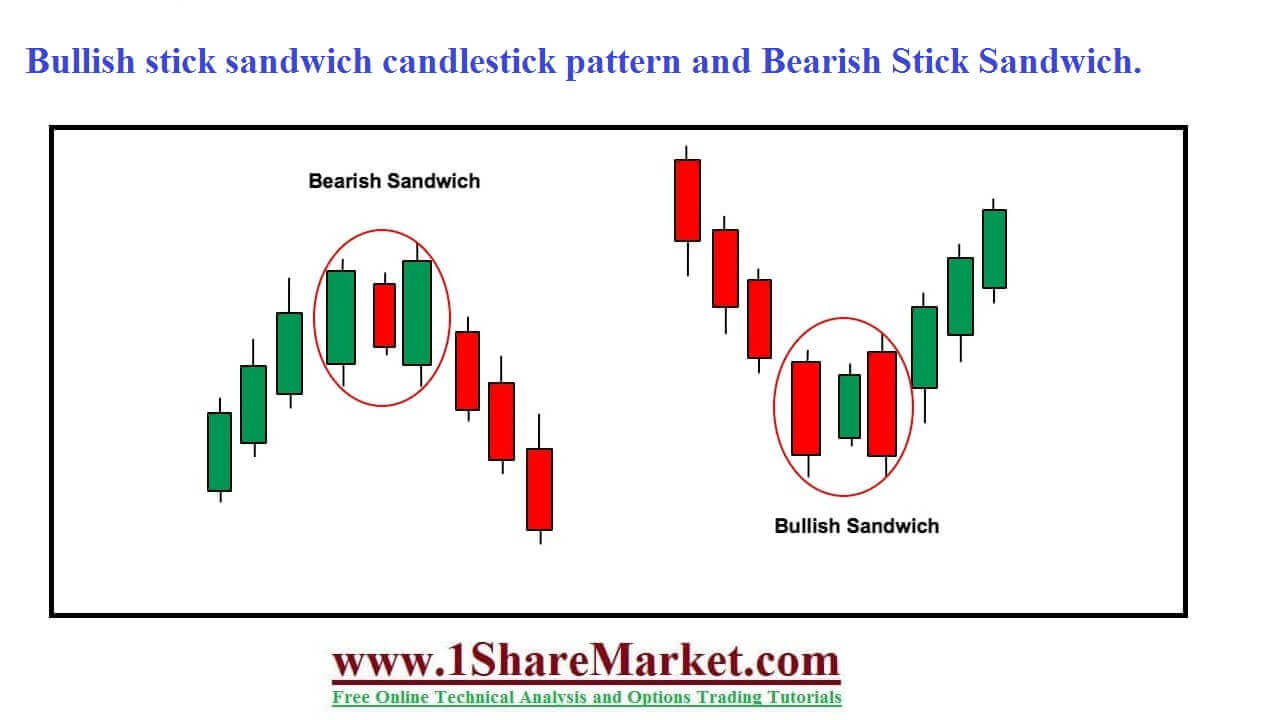
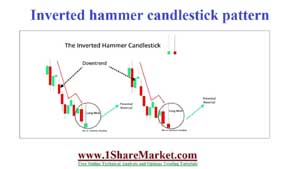
The candles on each side must have a larger trading range than the middle candle that makes them taller than the middle candle. The middle candle must be short so that it is engulfed by the first and third candle. The bullish sticks occur at a downtrend and the bearish stick sandwich must occur during an uptrend. Pattern occurs in both uptrend and downtrend so pay attention to the candle's colors. Like a bar chart, the daily candlestick shows the market at an open, high, low, and close prices for the day. They have a wide part called a real body which represents the price range between the open and close of that day trading. Traders must be careful to take note of the colors involved. The basic criteria include accounting for the color of the candlestick on both sides, as well as the color of the candlestick sandwiched in the middle. The theoretical meaning of the stick sandwich is that when the market is testing new lows it will produce a red day. It will unexpectedly open higher and will trend higher all day then closing at or near its high. The movement hints at the reversal of a downtrend and most short traders will proceed. Then prices open higher which accelerates shorts covering initially. The prices then drift lower to close at the same level as two days prior.
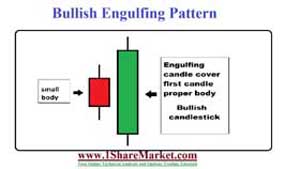
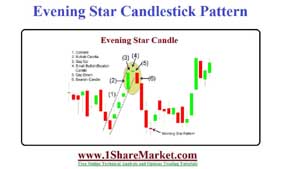
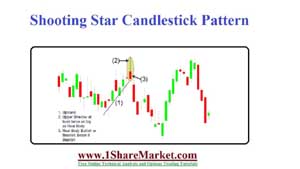
This pattern appears uptrend and the confirmation is required by the candles to follow the pattern. Here the first candle is white with a short upper shadow that represents a new high in the uptrend. Then comes a second candle with black color and has close below the open of the first candle. The third candle is white and has open below the Close of the second candle. It has the same level as the close of the first candle. The stick sandwich candlestick pattern looks like an ice cream sandwich. The closing price of the two black candles is equal. The outside candlestick will be long green candlesticks while the inside candlestick will be short and red. It will be engulfed by the outside sticks.
view moreThe bullish stick sandwich will look the same as bearish but with opposite color and trading patterns. Same as the bar chart the daily candlestick shows the market at an open, high, low, and close price for the day. They have a wide part called a real body which represents the price range between the open and close of that day trading. The recognition of candlestick is easy because they are present during a bull or bear market. Traders must be careful to take note of the colors involved. The basic criteria include accounting for the color of the candlestick on both sides, as well as the color of the candlestick sandwiched in the middle. The traders consider a bearish sandwich to run green-red-green and a bullish sandwich to run red-green-red color after recognition. The theoretical meaning of these is that when the market is testing new lows it will produce a red day. It will unexpectedly open higher and will trend higher all day then closing at or near its high. The movement hints at the reversal of a downtrend and most short traders will proceed.
© 2020 All rights reserved My blogs (Posts) and videos is only educational purpose on stock market and depend on my self research and analysis. I can't advice to buy/sell any stock. because I'm not SEBI registered.If someone wants to inter the stock market, then my advice is first learn from an authorize institution or take advice from your authorized adviser.
Design by
Sraj Solutions Pvt. Ltd. Additional Services : Refurbished Laptops Sales and Servise, Python Classes And SEO Freelancer in Pune, India