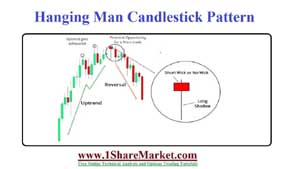
The hanging man pattern are called as the reversal patterns that consist of same type of candlestick and same shape as one is bearish while the other is bullish. It is made up of one candle in an uptrend of price chart called as bearish reversal pattern. Hanging man candlestick pattern has a lower wick and a short body at the top of the candlestick with little or no upper wick. So the body of the candle must be at the upper end of the trading range. The candle consists of a small real body, lower shadow, and little or no upper shadow. The formation will predict the name viewed as a bearish sign. A hanging man candlestick occurs at uptrend and warns that price starts falling.
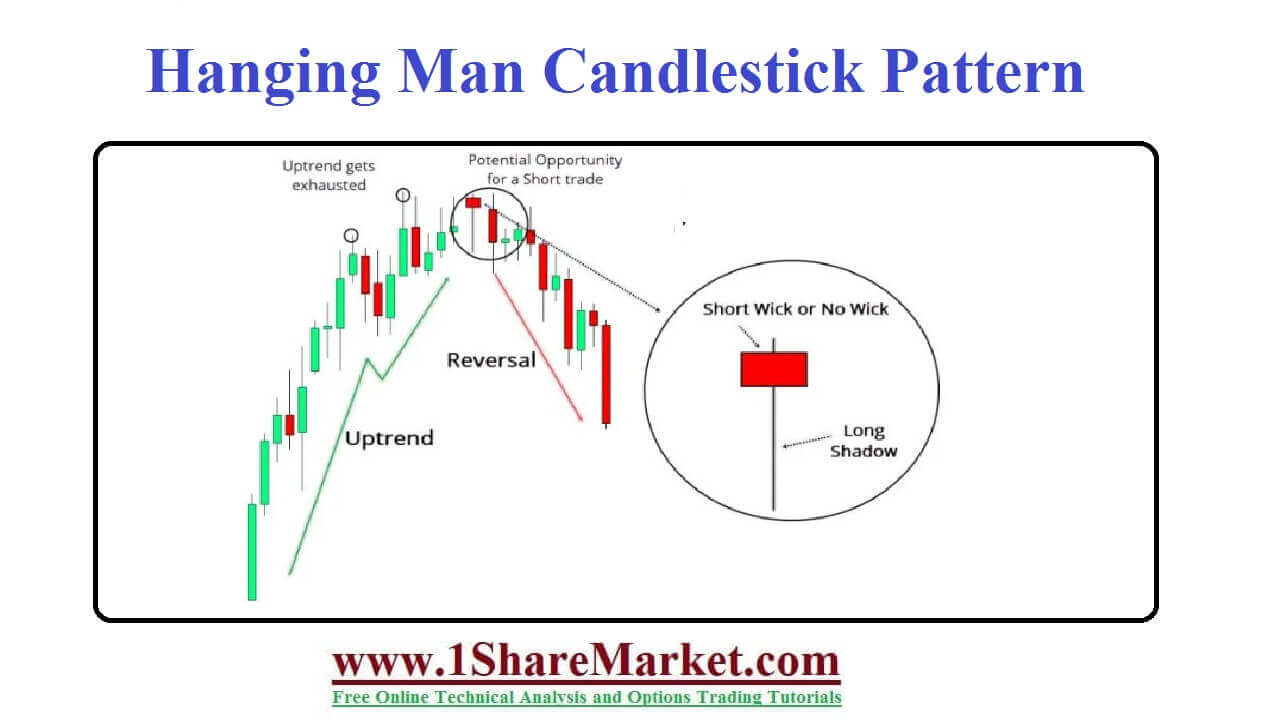
These shows the interest of the seller is starting to increase. Also called a bearish reversal candlestick pattern that occurs after a price is advance. The advance can be small, large, composed of few price bars moving higher overall. Then the lower shadow shows that the seller is able to take control for part of the trading period. It is a warning and its price must move lower on the next candle for the hanging man to be a valid reversal pattern called as confirmation. It’s the bearish signal which appears in uptrend and then warns potential trend reversal. This pattern is called hanging man because candlestick will resemble a hanging man with dangling legs. Here lower shadow is a bullish signal that will indicate demand for security forced the piece into the upper third of price range of that period. The pattern is a single-candle formation that is found at top of an uptrend. The pattern is popular among the traders as it is considered a reliable tool for predicting changes in the trend direction. It is considered a bearish candlestick pattern as it issues a warning that the market may reverse soon as the bulls appear.
The hanging man belongs to a single-candle formation family. The candle is created when the open, high, and close are at the same price and while there is a long shadow to the downside. Hanging man is a representative of the current market sentiment as a candlestick pattern.
view moreThose precede a bearish trading period will indicate a better average trading volume and have a lower closing price. Be careful to look for more indicators that support the hanging man such as the simple moving average to decide if the market is on the cusp of a reversal .It should be read as a warning than a shot indicator of a weakening market. A stop-loss is positioned above the recent high as the new high would mean the same trend will carry forward
Candlesticks will not help you with a price target so you should remain in the trade for the time period that the trend reversal is sustained and exit after asset price picks up. The hanging man is not a reliable indicator of a change in market direction. It should be backed up by supporting the evidence as longer wicks and better volumes on the next trading period after it appears.
© 2020 All rights reserved My blogs (Posts) and videos is only educational purpose on stock market and depend on my self research and analysis. I can't advice to buy/sell any stock. because I'm not SEBI registered.If someone wants to inter the stock market, then my advice is first learn from an authorize institution or take advice from your authorized adviser.
Design by
Sraj Solutions Pvt. Ltd. Additional Services : Refurbished Laptops Sales and Servise, Python Classes And SEO Freelancer in Pune, India